Automated FLAG emissions calculations: how to solve a carbon accounting blindspot
Meet compliance and fill a crucial gap in calculating a comprehensive carbon footprint for your business with Normative’s latest feature. Find out how the automated FLAG emissions solution can make a difference for you today.


There’s a key blindspot in carbon accounting that has been holding many businesses back from calculating a comprehensive carbon footprint. It concerns emissions related to land use.
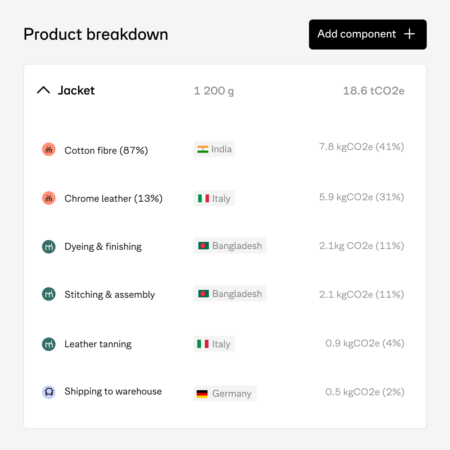
This gap in business’ calculations is growing, due to the fact that they cannot isolate the land-related part of their emissions. To illustrate the challenge, let’s look at the case of getting a tomato onto a supermarket shelf. In this instance, a business can’t separate the emissions used to grow the tomato from those produced as part of the process of transporting and packaging the product. Meanwhile, compliance requirements are pushing businesses to find a solution, such as those from the Science Based Targets initiative for Forest, Land and Agriculture and the Greenhouse Gas Protocol land-sector guidance.
That’s why Normative has released its fully automated, standards-aligned FLAG emissions solution, allowing businesses to meet these requirements with confidence.
What are land-related emissions?
It’s not just energy or industrial processes that produce carbon emissions that businesses need to account for – the way land is used and managed can also heavily impact a carbon footprint. These land-related emissions are especially prevalent within supply chains and account for these impacts, providing a more holistic view of your footprint.
There are a few categories that these land-related emissions can fall into:
Land Use Change (LUC) Emissions: These relate to the emissions that occur when the purpose of a piece of land is changed, leading to a release of stored carbon. An example would be when a forest is converted into agricultural land, a change that can lead to the release of significant amounts of CO2.
Land Management Emissions: These are emissions caused by ongoing activities on managed land. This can include:
- CO2 emissions when farming practices cause changes in soil carbon
- Non-CO2 emissions like methane (from livestock) or nitrous oxide (from fertilizers) in agricultural operations
Land Removals: These emissions occur when carbon dioxide is removed from the atmosphere, often through natural processes like reforestation or improved soil health. In general these are reported separately to demonstrate positive impact.
How can Normative’s automated FLAG emissions solution help?
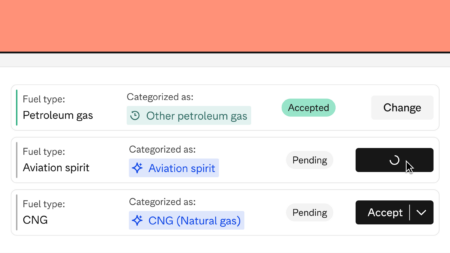
Normative’s advanced model for Forest, Land, and Agriculture (FLAG) means that businesses can now make SBTi-aligned land-related emissions calculations, as well as automating the process. This model integrates multiple databases to cover both spend and activity data, allowing for more comprehensive reporting on land-intensive value chains.
This unique solution fills a critical compliance gap that had previously not been addressed by the industry, providing support for activity data, which is enforced under current FLAG guidance.
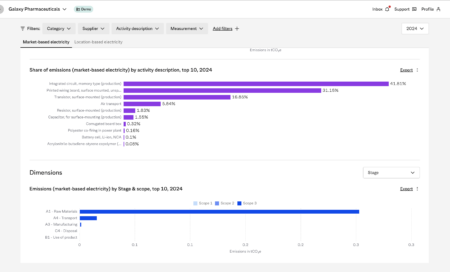
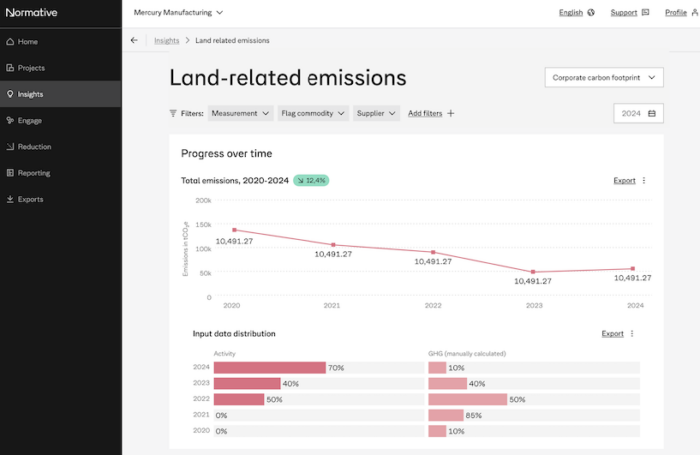
Businesses can also track FLAG emissions via a dashboard where results can be viewed, filtered and exported, for instant access.

For those businesses focused on meeting compliance requirements, Normative’s platform can automatically calculate and deliver the six key land-related emission types:
- Net Land Emissions (this comprises of emissions from Land Use Change + total Land Management emissions minus those from Land Removals)
- Land Use Change (LUC)
- CO2 Land Management
- Non-CO2 Land Management
- Total Land Management (this represents the total C02 emissions from Land Management + non-CO2 emissions from Land Management)
- Land Removals
Comply today, adapt for tomorrow
The feature has been developed to both allow businesses to comply with FLAG and GHGP requirements, and set them up to be able to adjust as these demands change.
Transparent methodologies mean that each calculation is accompanied by details on data scope, models used, and assumptions for full auditability.
The future-proof nature of the platform is designed to adapt to evolving reporting standards without overhauling the core Normative system, making it easy to adjust along with future updates to land-sector guidance.
How can businesses benefit from addressing FLAG emissions?
A business’ carbon footprint can be impacted by the way in which land is used and managed – this is particularly true within supply chains. For those businesses that have suppliers from the agriculture, forestry or food and beverage sectors, for example, getting a grip on these emissions is increasingly critical.
Being able to isolate land-related emissions is going to deliver higher granularity across agriculture, fast-moving consumer goods, construction, and United States supply chains. It will also strengthen compliance with the Science Based Targets initiative for Forest, Land and Agriculture and the Greenhouse Gas Protocol land-sector guidance. Here’s a quick summary of the opportunities open for the businesses that address their FLAG emissions.
- Enhanced reporting: More accurate and comprehensive data for your business’ climate reports and target setting (especially FLAG).
- Strategic insights: Get a deeper understanding of land’s role in your business’ carbon footprint, paving the way for more impactful reduction strategies.
- Clearer data traceability: report with confidence thanks to improved transparency on how land impacts are calculated from source to result.
- Prioritize the gathering of activity data: even when businesses don’t have the best activity data available, emissions can still be estimated leading to a greater understanding of where to focus efforts on getting activity data.
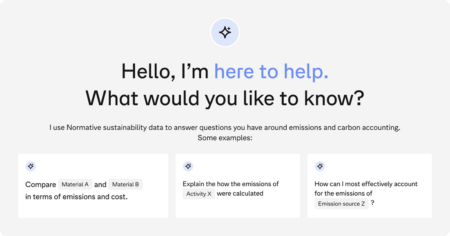
Take your next step: speak with our experts
See for yourself how Normative’s automated FLAG emissions calculations and dashboard can fill a critical carbon accounting gap for your business.