Emission Intensity Tracking: how to translate emissions into business language

Many organizations track their total carbon emissions, but what proportion can put this into the context of their business? Find out how Normative’s Emissions Intensity Tracking feature can act as a key enabler of core business metrics.

There is a latent potential within carbon emissions data that could hold the key to making real improvements to your business’ performance – but it needs to be tapped into. While a lot of organizations have a view of their total (absolute) emissions, this figure alone doesn’t provide any insight into the impact this data could have across different areas of a business. To get to that level, where an organization can understand and communicate its carbon performance in the context of key business activities, Normative’s Emissions Intensity Tracking feature can help.
Why is it important to track carbon emission intensity?
Carbon emissions need to be translated into business terms at a granular enough level to support data-driven sustainability decisions across all areas of a business. Without this, businesses will have no way of knowing what they need to change or the areas they need to prioritize in order to make improvements.
There are three core drivers for adopting intensity metrics:
Efficiency opportunities
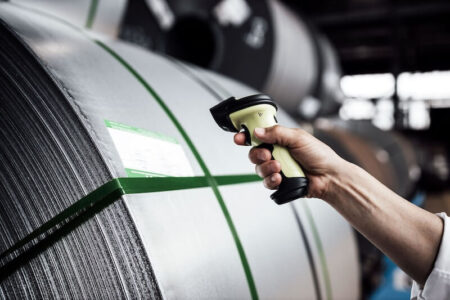
There’s a great chance to make efficiency improvements across multiple departments and industries. Take the manufacturing industry as an example. When a manufacturer can benchmark CO₂ per ton of output, they can identify which production lines have the highest intensity and plan actions to reduce this. This not only makes a real impact on reductions, it can also have a positive impact on a business’ bottom line.
Regulatory requirements
Many companies have intensity-based targets, even without absolute reduction goals. Emissions intensity tracking is required or permitted by a number of frameworks. For instance, the Science-Based Targets initiative (SBTi) requires or permits physical intensity targets under the Sectoral Decarbonization Approach (SDA). This metric (for example, CO₂ per ton of product or per m² of floor space) applies to high-emitting sectors such as heavy industry.
Similarly, the SECR in the UK requires at least one intensity ratio (e.g. tCO₂e per turnover) for large quoted companies. The SFDR in the EU also requires asset managers to disclose GHG intensity of investee companies, typically CO₂e per € revenue.
An inability to present these metrics could risk non-compliance for your business.
Investor pressure
Investors are already using carbon intensity to assess operational efficiency and climate risk. WACI (Weighted Average Carbon Intensity) is now widely used in portfolio reporting as an emissions per revenue metric, so companies without intensity data risk falling behind on ESG transparency and could limit access to capital.
How Normative’s Emissions Intensity Tracking can boost key business metrics
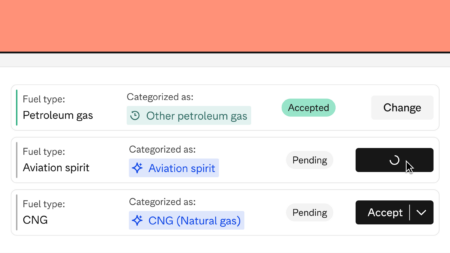
Emissions Intensity Tracking is a powerful feature within Normative that allows your organization to understand and communicate its carbon performance in the context of key business activities. Instead of solely looking at total (absolute) emissions, this feature pairs your emissions data with relevant business metrics, providing a normalized view of your carbon footprint.
The feature acts as a core enabler of financial performance, regulatory compliance, and operational decision-making. As a result, its value can be felt beyond sustainability teams that can benefit from streamlined SBTi reporting and the ability to communicate a compelling story to the board.
CFOs and their finance teams can link carbon data to financial performance and capex strategy through tracking emissions intensity. Their colleagues in Operations and Production teams can prioritize actions using intensity outliers by site or product. There’s significant benefit to be had across a business – here’s how it works.
Emissions Intensity Tracking allows your business to:
- Reveal efficiency gains: Absolute emissions show your total impact, but intensity tells your efficiency story. It helps explain how your total emissions might rise as your business grows, while still demonstrating improved carbon efficiency (e.g., CO₂ per euro of revenue or per unit of product).
- Identify hotspots and inefficiencies: Users can pinpoint high-intensity production lines, facilities, or product categories, enabling them to prioritize actions and drive ROI with carbon efficiency data.
- Support reporting and target setting: Many companies have intensity-based targets, even without absolute reduction goals. The Emissions Intensity Tracking feature means businesses can meet the requirements of regulators requiring such metrics. The built-in support for metrics like product tonnage and facility area for footprint-level performance tracking and target validation will ensure businesses are ready to meet the demands of the SBTi’s SDA.
- Align with investor expectations: The feature allows users to associate emissions with revenue, using predefined GHG intensity metrics (e.g., CO₂ per € revenue) to meet the metrics investors are increasingly focusing on. It will also enable businesses to track intensity over time, so that they can clearly demonstrate carbon efficiency improvements to investors.
- Translate emissions into business terms: By linking emissions to metrics like revenue, product sales, or employee count, it makes your carbon data more relatable and actionable for various business stakeholders. Not only does this make reporting simpler, it sets up employees across the business to take data-driven sustainability decisions.
- Share a strong, credible sustainability story: Intensity tracking provides clear, public-facing proof of progress and a strong narrative tool for communicating your sustainability journey.
In detail: what to expect from Normative’s Emissions Intensity Tracking
If you want to dig deeper, beyond the business impact the feature can have, here’s a breakdown of the specific functionality that helps deliver these benefits. Emissions Intensity Tracking allows businesses to:
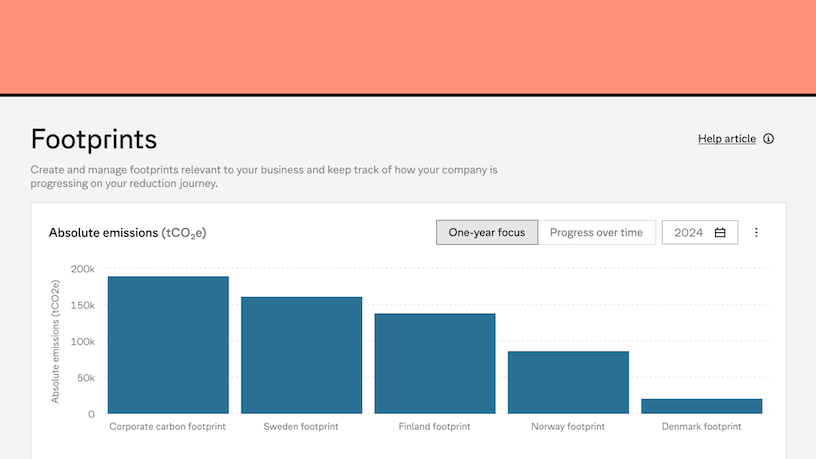
View emissions in context
Analyze your carbon footprint in both absolute terms (total CO₂e) and normalized terms (emissions per unit of business metric) for any given period.
Compare performance over time
Track year-over-year changes in both total emissions and emissions intensity, revealing efficiency trends even as your business grows or changes.
Compare within a year
Benchmark different parts of your business on a like-for-like basis by normalizing emissions (e.g. per product, per square meter, per employee), enabling fair comparisons across departments, products, or sites in the same timeframe.
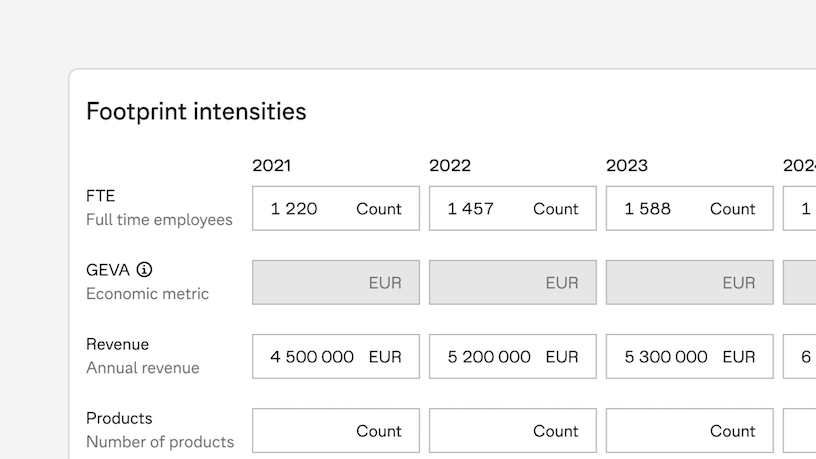
Work with built-in metrics
Instantly calculate intensities with built-in metrics – per Full-Time Employee (FTE), per unit of Value Added (GEVA), per revenue, per product unit or tonnage, per facility floor area.
Gain actionable insights
Identify improvements or regressions in carbon efficiency that absolute figures alone might hide, helping communicate progress to stakeholders in relatable terms.
Next steps
Does your company fall into any of the below categories?
- High-growth company that needs to show efficiency gains in spite of rising absolute emissions
- Manufacturer and product-based firm needing to track CO₂ per unit to optimize production
- Business in a carbon-intensive industry that has to measure the impact of renewables or energy efficiency.
- Investor-facing business expected to align with demands for intensity transparency.
- Target-driven organization required to track progress against intensity-based climate goals (e.g. SBTi)
If so, your business stands to benefit most from tracking emissions intensity metrics. Get in touch with us today to start making your carbon emissions data really work for the benefit of your business.
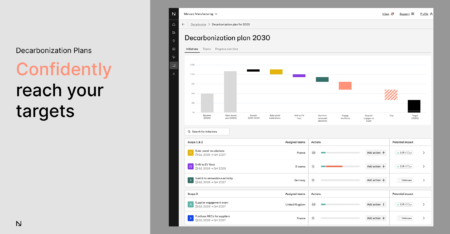
Put your carbon footprint into real-world context
Find out how Emission Intensity Tracking could become a driver of real business benefits across your organization.