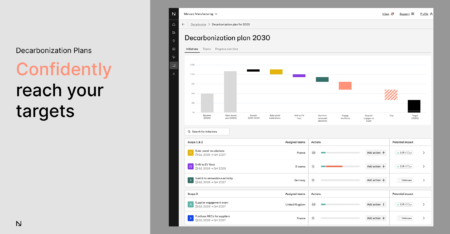
Understand your path to net zero with Normative’s emissions data dashboards

Normative launched new dashboards to help you make sense of your emissions.

Measuring your company’s carbon emissions is a critical step towards net zero – but only the first step. What’s next after you’ve measured? How can this information help in your sustainability journey?
After identifying the various activities that generate emissions, you have to interpret these insights and know where to take measures to reduce your emissions as you grow your business.
To simplify your company’s pathway to net zero emissions, we’re launching four new dashboards that will help you make sense of your emissions by offering actionable insights.
Get an overview of your emissions profile
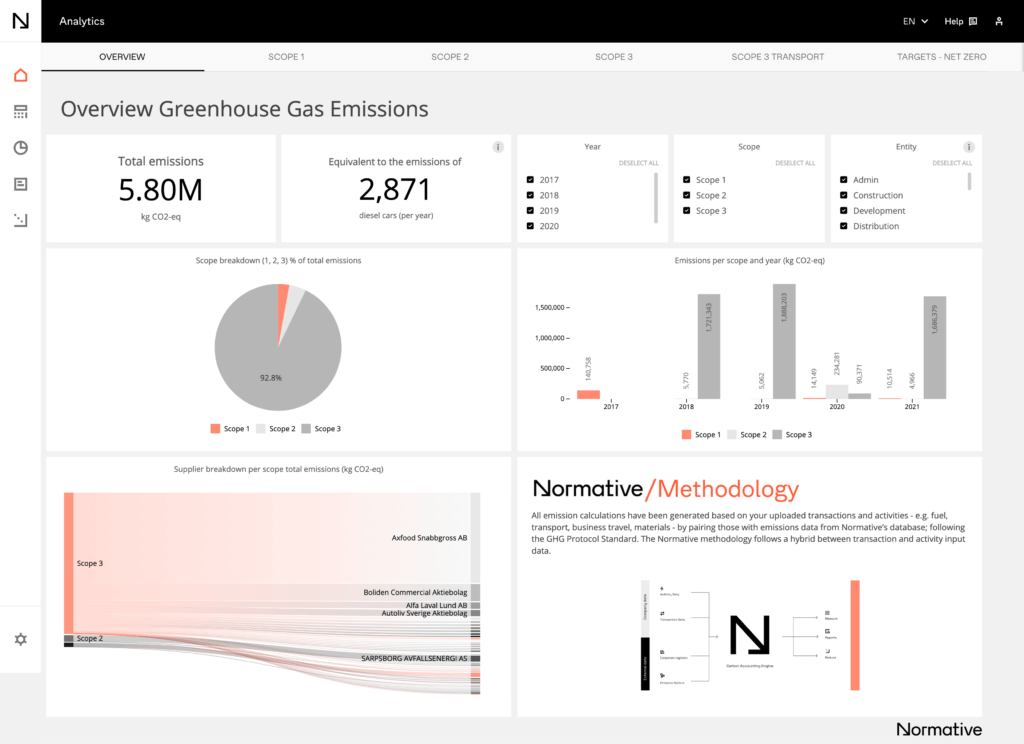
Starting with the basics, our Overview dashboard lets you see your overall emissions and identify which scope dominates your footprint. This high-level breakdown directs you towards the biggest impact areas for reducing emissions.
Once you get the outline of your emissions, you can delve into each scope and analyze them closely.
See your company’s scope 3 emissions
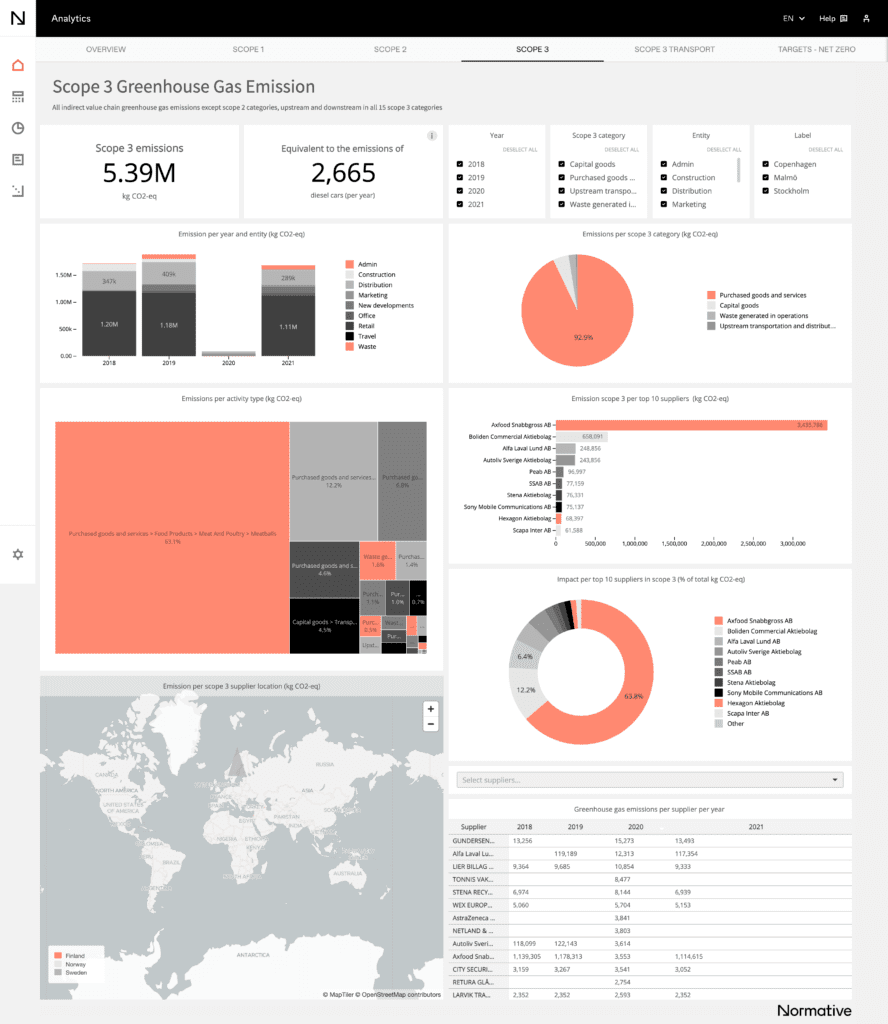
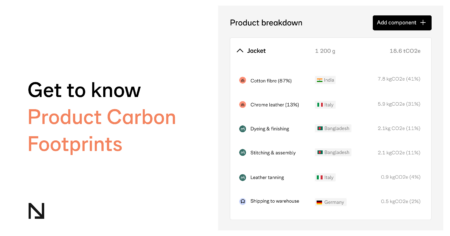
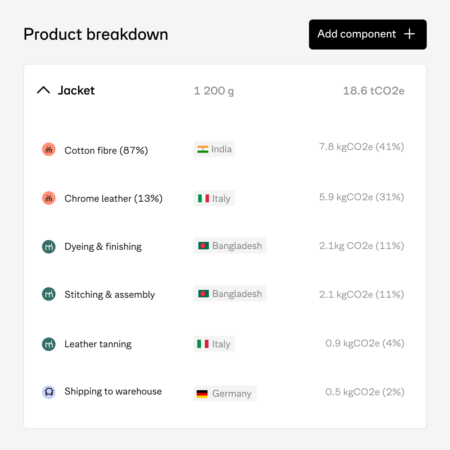
Normative’s automated breakdown of your scope 3 emissions saves you hours of data gathering.
The report is created from your financial data, and shows the emissions generated by your suppliers. This report makes it easy to understand where in your supply chain the majority of your emissions are coming from, which can direct your efforts in reducing the impact of the suppliers who are the highest emitters.
See your company’s scope 2 emissions
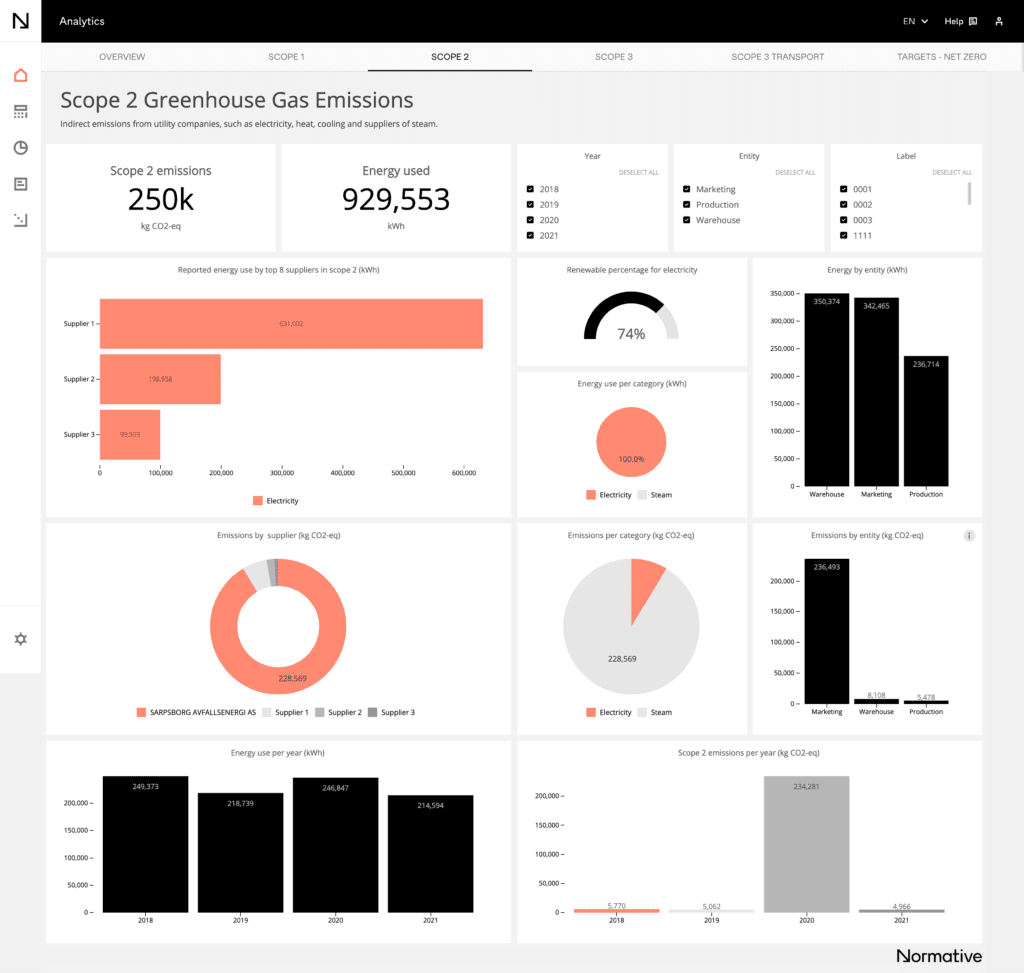
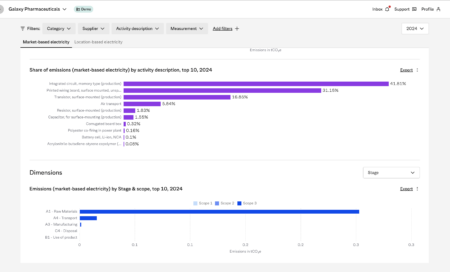
To direct your efforts efficiently, the Scope 2 dashboard enables you to identify your highest emitting suppliers and categories of activities within Scope 2, such as electricity, heating, cooling, etc.
The dashboard also shows the percentage of your emissions coming from renewable energy. Increasing that percentage is a surefire way to decrease your carbon footprint.
See your company’s scope 1 emissions
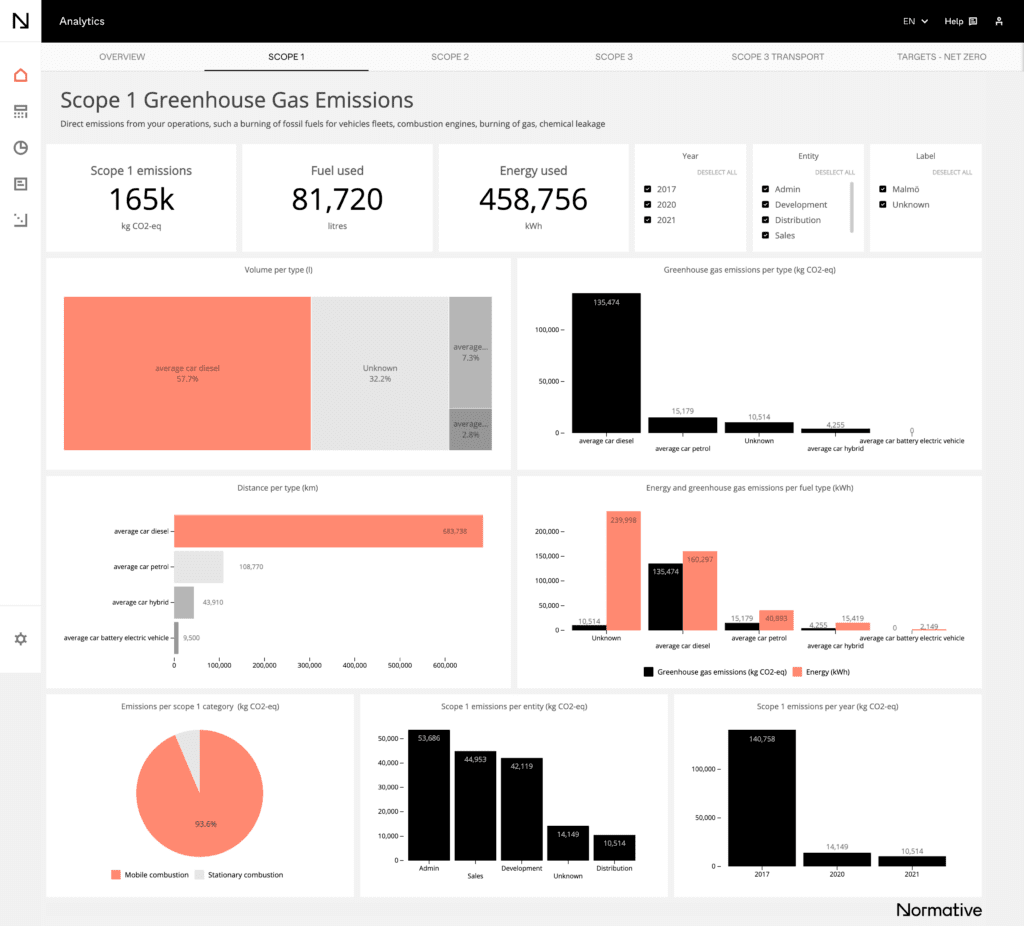
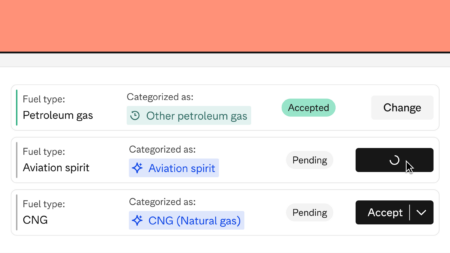
This is the scope that you have most control over, and can take the most immediate action on. The metrics break down emissions by fuel type, cost center, and category.
Tracking & reporting
To measure improvement, you’ll need to track your progress over time. The dashboards show how far you’ve come in your journey towards net zero by letting you filter by the year.
Your progress deserves to be celebrated and shared with your stakeholders. But they won’t need the entire data set – instead, you can choose the relevant metrics you want to share instead of exporting the full data.
Wrapping up
At its core, Normative is designed to help you reduce your company’s emissions. To do this, you first have to understand your emissions profile. And understanding involves more than access to data: it requires a way of putting the data in context, and presenting it in a way that can be acted upon.
We created these dashboards to remove the friction between where you are and where you want to reach in your journey to net zero emissions.
Your entire carbon footprint – visualized & actionable
Normative’s emissions accounting engine shows you your company’s full climate footprint – including your supply chain – and highlights the highest-impact reduction actions you can take.